First of all i would like to mention that this library was not meant to be a professional component library for usage in mission critical software but more a little project of mine to get a better understanding of Java Swing.
This means you'll have to use this library at your own risk !
This means you'll have to use this library at your own risk !
ATTENTION:
A short note to all of you that do not want to read all of the blogpost i just have to mention that the library depends on the trident animation library from Kirill Grouchnikov.
Means if you would like to use one of the components you need to have the trident.jar file on the classpath of your project. Additional to that you need to have Java 6 installed on your system.
Most of the components in the library are gauges that will hopefuly be useful to one or another. You will figure out that there are a lot of radial gauges but only two linear gauges, that's because i liked the radial gauges more.
This project is open source and you are welcome to participate and create additional gauges. I never did such a library before and so i hope the design is not too bad.
DOWNLOAD: SteelSeries.jar
Introduction:
The goal of this project is to provide a library of gauges for Java applications.
I will continue working on this library so if you would like to stay up to date you should check out the sources on kenai regularly or download the binary from there...
In principle there are two types of gauges available in the library
- Radial gauges
- Linear gauges
In the project you will find two packages
- gauges
- tools
Now i will try to give you a short overview of the gauges and their features.
Common features of all gauges are:
- customizable framedesign
- customizable background gradient
- customizable pointer/bar color
- threshold indicator
- threshold led in different colors
- adjustable scale
- indicators for min and max measured values
- threecolored track to visualize a area of interest
- automatic reset to zero mode
Common features of gauges with lcd display are:
- customizable lcd colors
- seven segment font (embedded ttf font)
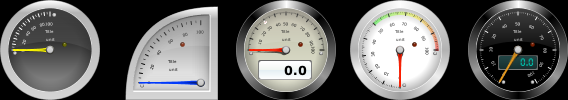
The available frame designs (today) are:
- Metal (default)
- ShinyMetal
- BlackMetal
 |
| available frame designs |
The available background colors are:
- DarkGray (default)
- LightGray
- White
- Black
- Beige
- Red
- Green
- Blue
Examples:
 |
| available background colors |
The available led colors are:
- Red (default)
- Green
- Blue
- Yellow
- Orange
The available pointer colors are:
- Red (default)
- Green
- Blue
- Orange
- Yellow
The available bar colors are:
- Red (default)
- Green
- Blue
- Orange
- Yellow
- Gray
Examples:
 |
| available led and pointer colors |
 |
| available led and bar colors |
The available lcd display colors are:
- Beige
- Blue
- Orange
- Red
- Yellow
- White (default)
- Gray
- Black
- Green
- BlueBlack
- BlueDarkBlue
- BlueGray
- Standard
- BlueBlue
 |
| available lcd colors and fonts |
Property overview:


Now i would like to give you an overview of all the different gauges so that you don't have to try them all to find the appropriate one.
Overview radial gauges...
Overview radial gauges...
 |
| Radial1 |
 |
| Radial1Lcd |
 |
| Radial1Square |
 |
| Radial1Vertical (vertical) |
 |
| Radial1Vertical (horizontal) |
 |
| Radial2 |
 |
| Radial2Lcd |
 |
| Radial3 |
 |
| Radial3Lcd |
 |
| Radial4 |
 |
| Radial4Lcd |
 |
| DigitalRadial |
 |
| DigitalRadialLcd |
Overview linear gauges:
 |
| Linear (vertical) |
 |
| LinearLcd (vertical) |
 |
| Linear (horizontal) |
 |
| LinearLcd (horizontal) |
Overview displays:
 |
| DisplaySingle |
 |
| DisplayMulti |
 |
| DisplayRectangular |
 |
| DisplayCircular |
Overview additional components:
 |
| Altimeter |
 |
| Clock |
 |
| Compass |
 | ||||||
| Level |
 |
| Radar |
There are two more components that might be useful if you'll try to create your own gauges.
 |
| FrameCircular |
 |
| FrameRectangular |
These components only contain the background image including the frame and the foreground image so that you could put your own stuff in between.
Features in more detail:
Animation:
You will find two methods to set a value
- setValue(double value)
- setValueAnimated(double value)
If you use the setValue(double value) method directly the pointer/bar wil be set directly to the target value. Everytime the value changes the component will fire a property change event named "value".
Tickmarks:
The tickmarks could be modified by the properties "minValue" and "maxValue". You could also use negative values for "minValue".
If you would like to adjust the labels at the tickmarks you could define the period between the labled tickmarks by the property "tickLabelPeriod" (e.g. a value of 10 will label 0, 10, 20, 30 etc.).
To enable/disable the tickmarks completly use "tickMarksVisible".
Threshold indicator:
The threshold of a gauge could be shown by a indicator which is a little red triangle that points to the threshold value. It could be enabled/disabled by the "thresholdVisible" property. If the current value exceeds the threshold a property change event will be fired by the component named "threshold". In addition to the event also the threshold led will start blinking if it is enabled by the property "ledVisible".
That's how the threshold indicator looks like...

Min and max measured value indicator:
I added two indicators to measure the minimum and maximum measured value. If you enable the indicator for the minimum measured value by set the "minMeasuredValueVisible" property to true you will see a little blue triangle that will follow the pointer/bar in the negative direction. The same will happen with the indicator for the maximum measured value which is a red triangle that will follow the pointer/bar in the positive direction and will stick at the maximum measured value. This one will be enabled/disabled by the property "maxMeasuredValueVisible". Each indicator could be reseted by a method named resetMinMeasuredValue() and resetMaxMeasuredValue().
It will look like this...

Track:
The track visualize a range of values that is of specific interest to the user (e.g. a critical temperature range from 70-100 deg celsius).
It will always be painted with a gradient of 2 or 3 colors. The track will start at the position that is defined by the value in the property "trackStart". The end of the track will be defined by the value in the property "trackStop" and the property "trackSection" will define a position between trackStart and trackStop.
Everytime you change one of these values a method called "checkSettings" will be called which checks the three properties "trackStart", "trackSection" and "trackStop" for their validity and correct them if there might be problems.
For example the track should start at 70.0 so we set trackStart to 70.0 and it should end at 100.0 so we set the trackStop to 100.0. It should have a point in between at the value 90.0 so we set the trackSection to 90.0. For each of these track related points you could define a color. In our example i set the "trackStartColor" to green, the "trackSectionColor" to yellow and the "trackStopColor" to red.
So it should look like this...

AutoResetToZero:
There are situations where you need your gauge to reset to zero after it measured a value. To enable/disable this feature you have to set the property "autoResetToZero".
If enabled the animation will be faster when the pointer/bar moves towards the target value and will be slower when it falls back to zero.
If disabled the pointer/bar will stick to the last measured value
Additional information:
Because many people ask me how i create these components i'll try to shortly explain the technique i used here.
First of all i created a prototype in Adobe Fireworks and put all the different parts of the component in different layers.
e.g.
After exporting the png to Adobe's fxg format i used my own fxg converter tool to convert the fxg data into Java2D drawing code.

Parts of this drawing code have been used for the images that will be created in the AbstractRadial.class. So the whole component creation started in the Fireworks png file where you have to put the different parts of the component in different layers of the png file.
The fxg converter tool creates for every layer a new BufferedImage. With all these images you could easily create a component because you just have to draw all these images in the right order and you will have your component.
Than you could animate one of the images (e.g. rotate the pointer image) and boom you are done. This will work for the radial gauges but not for the linear gauges, where you have to draw the bar on every change of the value.
With this approach i was able to create nice looking gauges within a few hours...BUT there is one problem with this approach, it's not very resource friendly.
You could imagine that every image has to be of the same size so that you could draw them on each other without scaling and shift but a image that only contains a pointer still needs a lot of transparent pixels which means memory.
For this reason i tried to reduce the usage of those "mostly empty" images but you'll still find them on some of them, which means here is still a lot of potential to reduce the size and increase the performance of these components.
I'm not sure if this really will be a performance or memory problem because even on my netbook with 1 GB ram and 1.6 GHz processor everything seems to be fine but you never know...right...?
If you have any comments i would love to hear them all...
Follow me on twitter if you like...

Tickmarks:
The tickmarks could be modified by the properties "minValue" and "maxValue". You could also use negative values for "minValue".
If you would like to adjust the labels at the tickmarks you could define the period between the labled tickmarks by the property "tickLabelPeriod" (e.g. a value of 10 will label 0, 10, 20, 30 etc.).
To enable/disable the tickmarks completly use "tickMarksVisible".
Threshold indicator:
The threshold of a gauge could be shown by a indicator which is a little red triangle that points to the threshold value. It could be enabled/disabled by the "thresholdVisible" property. If the current value exceeds the threshold a property change event will be fired by the component named "threshold". In addition to the event also the threshold led will start blinking if it is enabled by the property "ledVisible".
That's how the threshold indicator looks like...

Min and max measured value indicator:
I added two indicators to measure the minimum and maximum measured value. If you enable the indicator for the minimum measured value by set the "minMeasuredValueVisible" property to true you will see a little blue triangle that will follow the pointer/bar in the negative direction. The same will happen with the indicator for the maximum measured value which is a red triangle that will follow the pointer/bar in the positive direction and will stick at the maximum measured value. This one will be enabled/disabled by the property "maxMeasuredValueVisible". Each indicator could be reseted by a method named resetMinMeasuredValue() and resetMaxMeasuredValue().
It will look like this...

Track:
The track visualize a range of values that is of specific interest to the user (e.g. a critical temperature range from 70-100 deg celsius).
It will always be painted with a gradient of 2 or 3 colors. The track will start at the position that is defined by the value in the property "trackStart". The end of the track will be defined by the value in the property "trackStop" and the property "trackSection" will define a position between trackStart and trackStop.
Everytime you change one of these values a method called "checkSettings" will be called which checks the three properties "trackStart", "trackSection" and "trackStop" for their validity and correct them if there might be problems.
For example the track should start at 70.0 so we set trackStart to 70.0 and it should end at 100.0 so we set the trackStop to 100.0. It should have a point in between at the value 90.0 so we set the trackSection to 90.0. For each of these track related points you could define a color. In our example i set the "trackStartColor" to green, the "trackSectionColor" to yellow and the "trackStopColor" to red.
So it should look like this...

AutoResetToZero:
There are situations where you need your gauge to reset to zero after it measured a value. To enable/disable this feature you have to set the property "autoResetToZero".
If enabled the animation will be faster when the pointer/bar moves towards the target value and will be slower when it falls back to zero.
If disabled the pointer/bar will stick to the last measured value
Additional information:
Because many people ask me how i create these components i'll try to shortly explain the technique i used here.
First of all i created a prototype in Adobe Fireworks and put all the different parts of the component in different layers.
e.g.
- Frame
- Background
- Title and unit
- Pointer
- Knob
- Foreground
After exporting the png to Adobe's fxg format i used my own fxg converter tool to convert the fxg data into Java2D drawing code.

Parts of this drawing code have been used for the images that will be created in the AbstractRadial.class. So the whole component creation started in the Fireworks png file where you have to put the different parts of the component in different layers of the png file.
The fxg converter tool creates for every layer a new BufferedImage. With all these images you could easily create a component because you just have to draw all these images in the right order and you will have your component.
Than you could animate one of the images (e.g. rotate the pointer image) and boom you are done. This will work for the radial gauges but not for the linear gauges, where you have to draw the bar on every change of the value.
With this approach i was able to create nice looking gauges within a few hours...BUT there is one problem with this approach, it's not very resource friendly.
You could imagine that every image has to be of the same size so that you could draw them on each other without scaling and shift but a image that only contains a pointer still needs a lot of transparent pixels which means memory.
For this reason i tried to reduce the usage of those "mostly empty" images but you'll still find them on some of them, which means here is still a lot of potential to reduce the size and increase the performance of these components.
I'm not sure if this really will be a performance or memory problem because even on my netbook with 1 GB ram and 1.6 GHz processor everything seems to be fine but you never know...right...?
If you have any comments i would love to hear them all...
Follow me on twitter if you like...
